In previous articles we explained how to estimate the social welfare created by an economic activity. Besides, we described theoretically how to improve this welfare and concluded that the best approach was to try to enhance the value that consumers extract from the product or service consumed. In other words, to shift the demand curve to the right, which was done d following a trial-and-error process that required investment.
In this post we apply that theoretical analysis to telecommunications markets and, specifically, to mobile broadband. As the measurement of social welfare in isolation is not very relevant, our proposal is to compare the social welfare generated by mobile telephony in Western Europe with respect to the United States. In this way, we will be able to empirically assess which users have benefited more from competition among mobile operators, the Europeans or the Americans?
The potential of mobile connectivity to generate welfare
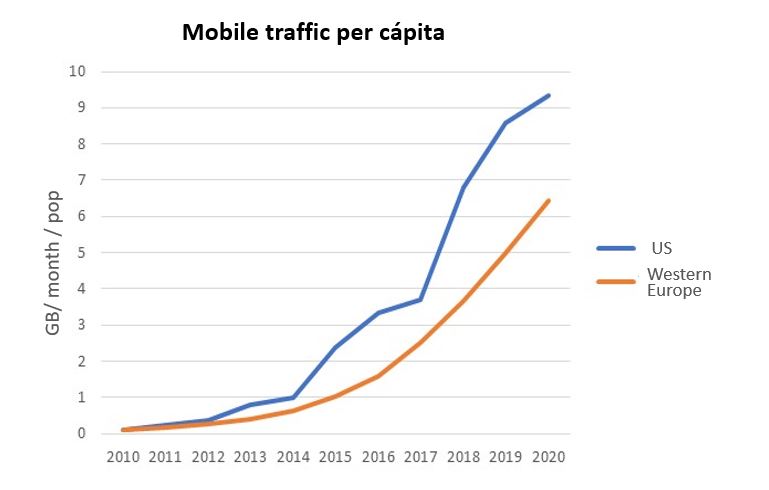
Each U.S. resident paid on average more than twice as much as a Western European in 2020 ($3.62 versus $1.59 per Gigabyte)[1] . They also spent a total of three and a half times more per month on mobile broadband than a European (USD 34 versus USD 10).
The above figures do not mean, however, that American users fare worse. As we explained in the aforementioned post, the utility that a person extracts from mobile connectivity services is determined by the volume of traffic they actually use and the value they place on each Gigabyte consumed. These are the parameters that indicate whether citizens and companies are taking advantage of the potential of mobile connectivity to generate welfare. As we shall see, in both cases the US far outperforms the EU, to the point of offsetting the higher price paid for each Gigabyte.
It is striking, firstly, that despite the higher unit price in the USA, approximately 50% more mobile data was consumed per person in 2020 than in Europe. And it is also striking that this has not always been the case. In fact, in 2010, when Blackberry still dominated the handset market and the transition from 3G to 4G was about to begin, each European consumed on average 20% more data than an American.
A virtuous circle of value and consumption
The described evolution does not fit well with the economic logic that tells us that if prices are higher, consumption is lower. In this case, the opposite has happened. This situation shows that competition in the U.S. is as intense or more than in Europe, but it is carried out in a different way, one that generates more value in the long run. Consistent with the theoretical analysis we proposed, it seems that a virtuous circle has been developing in the US for years, in which operators compete by trying to increase the value of each Gigabyte consumed.
This increase in value for the user makes it possible to offer higher prices without affecting consumption, resulting in higher revenue per user. This, in turn, generates incentives to make new investments in innovation and networks, which are necessary to remain competitive.
Estimation of social welfare
It is not easy to accurately quantify the value generated by the mobile telecommunications sector in the US and compare it with the situation in Europe. However, we can try to make simple estimates from actual price and consumption data. Considering that these data have been available since mobile broadband consumption was incipient, a first approximation could be to construct a curve of the quantities actually demanded for different price levels. To do so, we will use historical data since 2008, as shown in the graph.
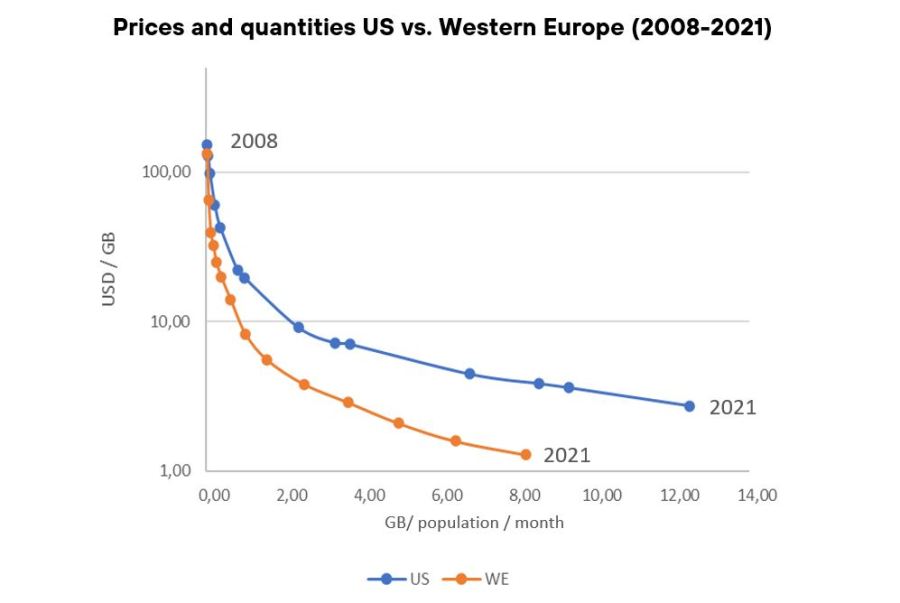
The graph illustrates the evolution of the dynamic process of competition between operators trying to increase the value of their products. It is not a demand curve as such, which would indicate the level of consumption for each price at a single point in time. However, it is quite close and allows comparisons based on real data.
Evolution of consumer surplus in the U.S. and Western Europe
From the data shown, the consumer surplus per inhabitant per month can be calculated for each year. This surplus would be the difference between the user’s willingness to pay for the consumption made and what is actually paid.
As already explained in the above-mentioned post, the demand curve reflects the value that end users place on each unit consumed. In practice, we can observe at each moment one point on the demand curve, given by the combination of price and quantity[2] that has actually occurred. We also know that each unit consumed has a value to the user at least equal to the market price, and almost certainly higher, since he/she would not have bought it otherwise. We do not know exactly how much higher, but we can make assumptions. In this case, we will take historical observations as a reference and assume that the willingness to pay per Megabyte consumed remains constant over time.
With the above in mind, the graph below shows the evolution of consumer surplus in the United States and Western Europe between 2011 and 2021.
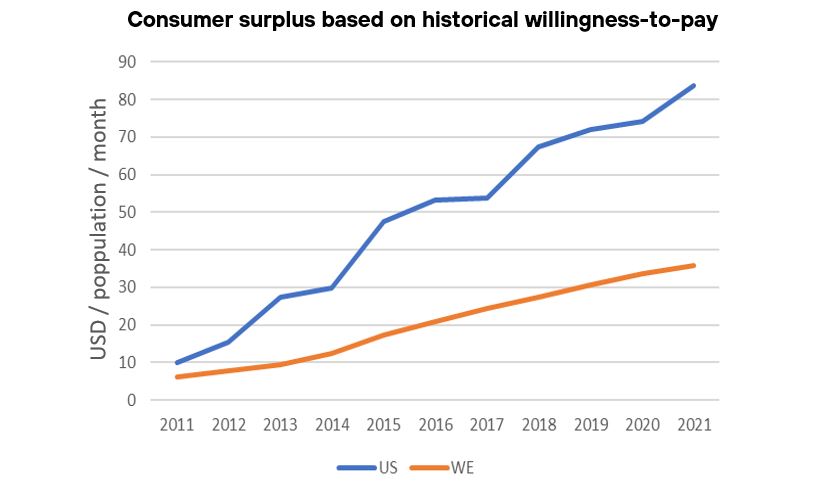
The big difference between the value generated in the US and the value generated in Europe is clear. Thus, according to the calculation performed, the average US consumer received in 2021 a net value for mobile connectivity consumption, after deducting the payment for the service, of USD 84 per month (USD 6.7 per Gigabyte consumed), 2.3 times more than the USD 36 per month enjoyed by an average European consumer (USD 4.3 per Gigabyte consumed).
Other estimates show similar results
Another approach to the problem is to take at each point in time the price and quantity that can be observed and make informed assumptions about the shape of the rest of the curve. In this way, the curve is independent of what has been consumed or paid for in previous years. Assuming for each year an elasticity at the known point of -0.4 (i.e., a 10% decrease in price would result in a 4% increase in traffic), and also that the demand function is linear, we obtain the following graph:
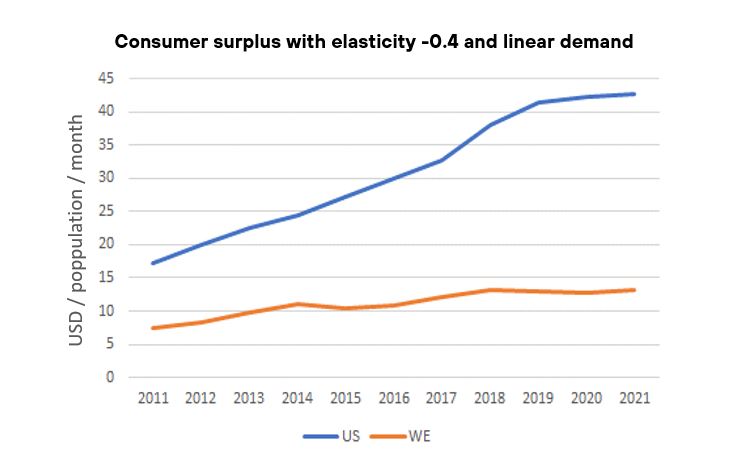
It is noteworthy that, with this second estimate, the difference between the US and Western Europe widens. The average consumer surplus in the US in 2021 would be USD 43 per month (EUR 3.4 per GigaByte), 3.2 times higher than in Europe, which would be USD 13 per month (USD 1.6 per GigaByte). It can also be seen that the absolute values are lower and grow less as time goes by. Given the assumption of constant elasticity over time, the slope of the demand curve becomes smaller and smaller as the years go by, the observed price falls and consumption rises. Consequently, the estimate of the willingness to pay for the first units consumed becomes smaller and smaller.
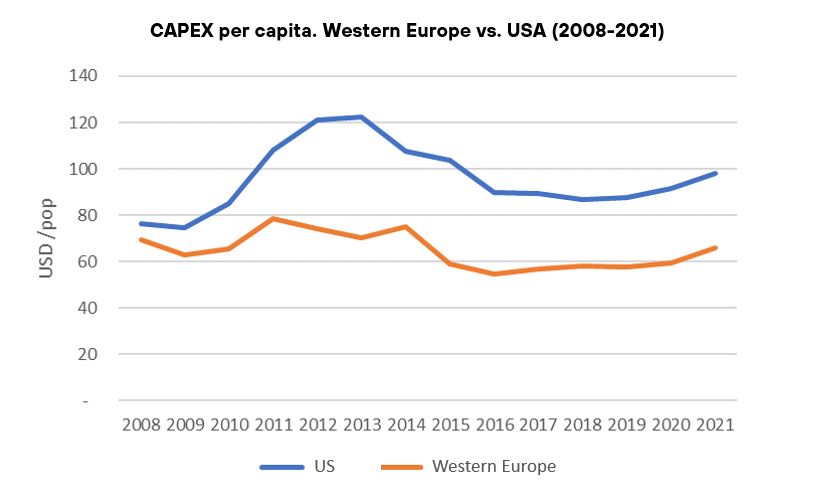
Relationship between welfare and investment
Mobile investment statistics[3] show a trend in line with the idea that the US competes differently from Europe. Over the last decade, US operators have invested 50% more per capita in mobile networks than those in Western Europe. This differential translates into higher-capacity networks that are made available to US citizens and companies to facilitate their digitization process.
A lower price does not ensure greater social welfare
For all the above reasons, it is advisable to avoid the widespread biased view that questions the US telecommunications market performance just by looking at the prices, neglecting other more relevant factors. The correct measure of market performance is the social welfare generated, as we have tried to explain in this and the previous posts in this series.
Despite the difficulty of obtaining accurate data and establishing international comparisons over long periods of time, the results shown in this post are illustrative. They invite us to reflect and eliminate prejudices about the relation between price levels and the creation of value for consumers. Paying a lower price does not always lead to a better outcome.
References:
[1] Source: Analysys Mason (2022). DataHub | Global and regional telecoms market data and forecasts (analysysmason.com)
[2] We take the average revenue per Gigabyte (ARPGB) as a reference for both price and willingness to pay for the last unit consumed.
[3] Mobile investment excluding spectrum. Source: Omdia (2022). Communications-Provider-Revenue-and-Capex-Tracker–4Q21. Communications Provider Revenue and Capex Tracker – 4Q21 :: O