Debt evolution
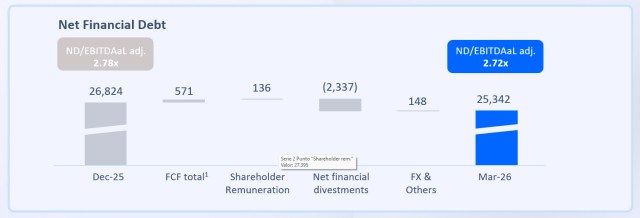
(1) Total FCF (continuing and discontinued operations) including employee commitments, VMO2 dividends and spectrum payments.
Net financial debt and commitments
Unaudited figures (Euros in millions)
| December 2025 | March 2026 | |
|---|---|---|
| Non-current financial liabilities | 30,120 | 28.626 |
| Current financial liabilities | 4,219 | 5.528 |
| Gross Financial Debt | 34,339 | 34.154 |
| Cash and cash equivalents | (6,564) | -6.269 |
| Current financial assets | (861) | -1.423 |
| Non-current financial assets | (3,980) | -3.759 |
| Mark-to-market derivatives adjustment (1) | 736 | 758 |
| Other current assets and liabilities | 1,097 | -494 |
| Other non-current assets and liabilities | 2,057 | 2.375 |
| Net Financial Debt | 26,824 | 25.342 |
| Lease Liabilities | 7,920 | 8.013 |
| Net Financial Debt including Lease liabilities | 34,744 | 33.355 |
Notes:
(1) Includes the market value of cash flow hedges related to debt instruments and the market value of economic hedges associated with gross employee benefit commitments.
Financing activity
In Q1 26, Telefónica Group raised long term financing by €3,278m and VMO2 raised €2,386m equivalent.
Financing activities in Q1 26 included:
- In Jan-26, T. Emisiones launched a €1,750m green hybrid bond (two tranches; €900m (5.25 years reset date) and €850m (8.25 years reset date). The Company launched a tender offer for the purchase of existing hybrid bonds with first reset dates in Sep-26, May-27 and Nov-28. T. Europe B.V. accepted the purchase in an aggregate principal amount of €1,538m. On Feb-26, we have exercised the option to redeem the €212m outstanding of the hybrids with first non-call dates in Sep-26 and Nov-28
- In Feb-26, Telefónica Emisiones closed the issuance of a senior bond in the Swiss franc market of CHF170m (8 years maturity and 1.5075% annual coupon) and T. Emisiones closed a €1,000m green bond (7.25 years maturity)
- In Mar-26, after receipt of the required regulatory approvals and fulfilment of all conditions precedent, the €300m syndicated financing entered into by Compañía Mayorista de Fibra S.L. (FiberPass) in Nov-25, with a maturity in Mar-31, became available
Telefónica financing activity has allowed to maintain a solid liquidity position of €17,739m (€10,047m of undrawn committed credit lines; €9,281m maturing over 12M). As of Mar-26, the average debt life stood at 11.4 years. Telefónica and its holding companies continued their issuance activity under the Promissory Notes and Commercial Paper Programmes (Domestic and European), maintaining an outstanding notional balance of €1,100m as of Mar-26.
Financial debt
Total Financial Liabilities Breakdown
Unaudited figures (Euros in millions)
| March 2026 | |||
|---|---|---|---|
| Bonds and commercial paper | Debt with financial institutions | Other financial debt (including governments) and net derivatives | |
| Total financial liabilities (1) | 82% | 6% | 12% |
(1) Includes positive value of derivatives and other financial debt
Net financial debt plus Lease Liabilities structure by currency
Unaudited figures (Euros in millions)
| March 2026 | ||||
|---|---|---|---|---|
| EUR | BRL | HISPAM | OTHER | |
| Net financial debt plus Lease Liabilities structure by currency | 86% | 15% | -1% | 0% |
Financial expenses
Interest payments totaled €483m in Q1 26 and increased 2.5% y-o-y due to temporary effect of hybrid coupons related to liability management in this quarter. The effective cost of debt related interest payments (L12M) decreased to 2.81% as of Mar-26 (Mar-25: 3.30%).
Note: For further information, please access the January – March 2026 Results Report.