In the regulatory and competition policy realm, maximizing economic welfare should be the definitive policy goal. However, and despite the abundant literature in textbooks and scientific articles, misconceptions about the nature of welfare persist. The aim of this post is to recall the basic economic logic behind the concept of “welfare” and reflect on whether the traditional focus on prices as a policy objective is well targeted.
Usage drives value
The foundation for the calculation of welfare is the demand curve. Assuming that value can be proxied by willingness to pay, the demand curve represents the value attached by consumers to each unit of product or service consumed. The curve is generally depicted as downwards sloping, to account for the fact that as consumption increases, a lower value is attached to each additional unit consumed [1].
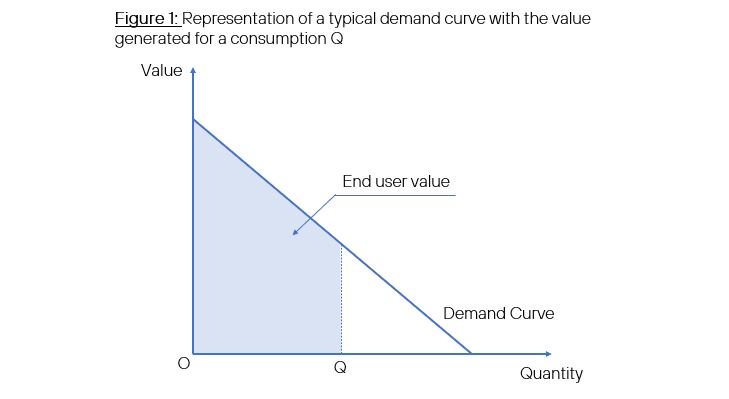
The total value created by the consumption of a certain amount of a good or service is the sum of all the values attached to each individual unit. It can be represented graphically as the area below the demand curve, as shown above. It is clear that the value accrued to consumers depends on usage: the higher the usage, the higher the value.
Production costs determine net value to society and welfare
Before they are consumed, goods and services need to be produced. Production requires resources that, if dedicated to a particular good or service, cannot be employed anywhere else. Even the most elemental activity, such as picking up berries from a tree, will require time that could be used in something else. The cost of production therefore needs to be subtracted from the value acquired through usage in order to determine the social welfare created by the activity.
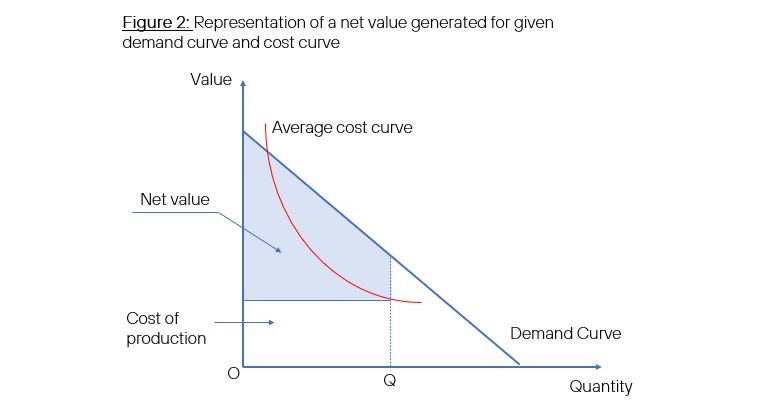
In the graph, the curve plots the average cost of production for each total quantity produced, i.e., total costs divided by the number of units produced. At the same time, it is assumed to decrease as the number of units produced increases, which is always the case if there are relevant fixed costs, such as a production machine or an antenna of a mobile network. For simplicity, we assume there is only one producer.
Prices determine how value is apportioned between consumers and producers
Even from the earliest stages in the development of an economy, most of the goods consumed by an individual are produced by another individual and obtained through trade. An exchange price then appears that, somehow, distributes the welfare created among the two parties involved, that is, the final user or buyer, and the producer or seller.
Of course, both the consumer and the producer will try to keep for themselves as much value as possible, but it is important to note that the actual distribution has no direct impact on total welfare, at least not in a static context.
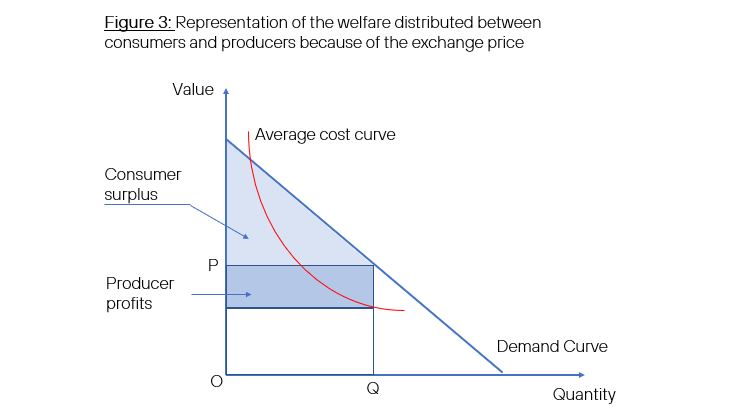
The graph above illustrates how prices determine the distribution of welfare, assuming that the price is the same for all units and is set at a level equal to the willingness to pay for the least valuable unit consumed. The corresponding consumer surplus and producer profits are graphically deduced.
It can readily be seen that even if the welfare created for consumers by this particular activity always increases with usage, for that outcome to be sustainable producers need to at least cover their cost of production. Fixed investments can be taken for granted in the short term, and consumer welfare can be created relatively effortlessly by squeezing an existing production machine or a telecom network to their full capacity and allowing consumers to enjoy the consumption of all the output. However, that situation cannot last unless producers cover their cost of production and are thereby incentivised to invest and renew the assets as they become obsolete.
So, how can social welfare be increased?
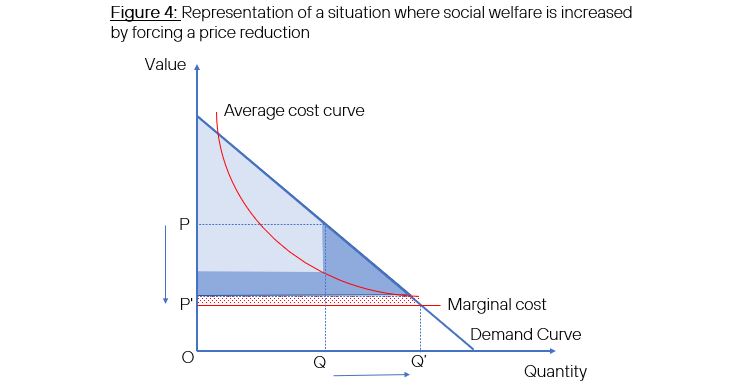
In the very short term, in which the value for consumers and the production means are given, the most immediate way to increase total welfare is to induce an increase in usage through a reduction in prices. A benevolent regulator could try to estimate the cost of producing an additional unit (the “marginal cost”) and cap prices at that level (see figure 4 below).
However, this raises two issues. The first one is the fact that, while consumers will always be better off with the price reduction, producers will not. It is generally argued that as long as the increase in consumer surplus is higher than the decrease in producer profits, society will be better off as a whole, at least in the short term, but it is still true that the outcome will be attained at the expense of one of the parties.
The second one is the risk of setting a price that does not allow the producer to recover the fixed costs (see the red area in the figure 4). The information on cost structures and the shape of the demand curve available to the regulator is never complete or fully accurate, and the pressure to induce price reductions is high. If it is easy to see that there is a risk of underestimating the costs that the producer is allowed to recover, or to overestimate consumption levels for a given price. If that happens, payments by consumers will not allow the recovery of fixed costs and future investments by producers may be at risk [2].
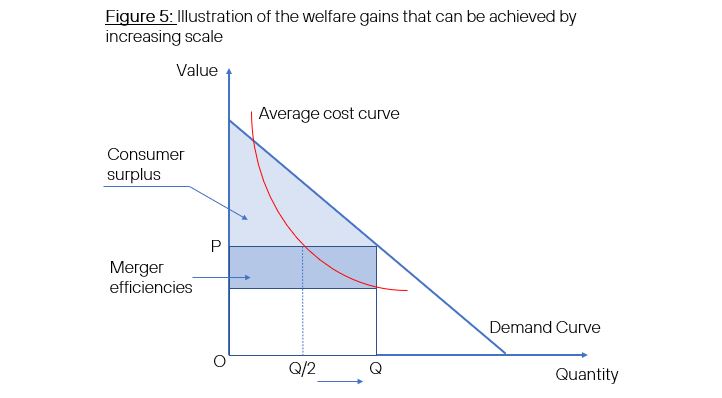
A second way to increase welfare is by exploiting economies of scale. In sectors with high fixed costs, the average cost per unit decreases as more units are produced. When this happens, having several producers is not efficient from a cost perspective. This is illustrated in the graph below, where merger synergies are created without any impact on consumer surplus, freeing up resources that can be used elsewhere.
Most interestingly, much larger increases in the welfare created by an activity can be triggered by shifts in the demand curve, consequence of a rise in the value that consumers extract from consumption, as shown in the graph below. Producers have all the incentives to trigger and promote this process, and that is why companies devote a large number of resources to innovate and facilitate adoption by users.
Facebook/Meta, for example, is investing billions in R&D for Virtual Reality glasses because it believes the value of social networks for end users will be much larger in a VR context. In terms of our simplified economic model, what they are trying to do is precisely to shift to the right the demand curve for social networks.
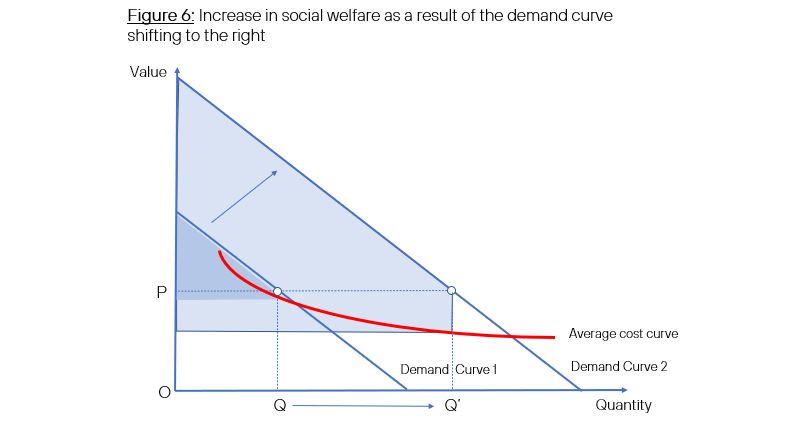
A relevant question for policymakers is whether the level of profits today can influence the likelihood of future shifts in demand as the one depicted in the graph. Regulators and competition policymakers usually consider that consumer preferences are an independent variable, not impacted by producer profits, but that assumption does not hold when dynamic considerations enter the model.
It is more realistic to assume that the level of profits, both current and expected, shapes to a large extent the incentives and possibilities for producers to invest in enhancing the value of their products, as described above.
If that is the case, policymakers should not take for granted that promoting price reductions to induce more usage through a movement within a given demand curve, is always positive for welfare. They should also evaluate how their actions prevent future shifts in those demand curves that would reflect an increase in the value of products and services to consumers.
In a nutshell
1. Social welfare is a measure of how a productive activity improves the life of individuals. It is driven by usage and the utility consumers extract from the activity.
2. Prices have no direct impact on social welfare, but they determine how it is apportioned between consumers and producers.
3. In the short term, lowering prices may increase social welfare by moving the equilibrium point to the right in the demand curve. However, this has the risk of hindering future investments if producers are constrained in the recovery of their fixed costs.
4. The best way to increase social welfare is to shift the whole demand curve to the right. This is a process usually driven by producers, by means of a discovery process fed by the resources at their disposal and the expectation of future profits.
References:
[1] See Varian, H. R. (2019): Intermediate Microeconomics: a modern approach, 9th edition. Norton, New York.
[2] See Hausman, J.A. (2000) “Regulated costs and prices in telecommunications”, Massachusetts Institute of Technology, Cambridge, USA, available at Doc 7 .tif (mit.edu)